
Logan River
The population of semi-arid northern Utah depends on rivers to deliver water stored in mountain snowpack to population centers in the semi-arid valleys of northern Utah. The Logan River is an important tributary to the Bear River, which in turn is the largest stream flowing into the Great Salt Lake. Previously, there were no streamflow reconstructions for the Wasatch Front, and few tree-ring chronologies existed from which reconstructions are typically developed.
The Wasatch Dendroclimatology Research (WADR) Group is collecting new chronologies in the region, including unconventional species such as Rocky Mountain juniper (Juniperus scopulorum), which has not previously been used in climate reconstructions. Two water-year, mean annual flow reconstruction models were created: a Local model of two within basin Rocky Mountain juniper chronologies, and a Regional model, which included two additional chronologies. The additional chronologies included one limber pine (WY037 from the International Tree-Ring Data Bank), and one two-needle pinyon pine. The reconstruction period for both models extends from 1605 to 1921, with 1922 to 2005 or 2010 as the instrumental period for the Regional and Local models, respectively.
References:
Methods
The chronologies created by this study were analyzed for their relationship to climate. Those significantly (p>0.05) correlated to either mean maximum monthly temperature or mean monthly precipitation were retained for modeling.
We used two groups of predictors to model Logan River water year MAF: a Local model that considered predictors within 100 km of the basin boundary, and the Regional model that considered all predictors within an area of putatively similar hydroclimate. Each group of predictors were entered into a stepwise linear regression model ordered by their correlation to Logan River MAF. Predictors were retained based on AIC. The models were verified using a split calibration procedure. The model skill of split and full calibration were assessed using r2, adjusted r2, reduction of error (RE), coefficient of efficiency (CE), and the PRESS statistic.
Local model predictor chronologies: Left Hand Fork (UT), Jardine Juniper Trail (UT)
Regional model predictor chronologies: Left Hand Fork (UT), Jardine Juniper Trail (UT), Rattlesnake Mountain (UT), Red Hills (WY)
Local Calibration and Validation
| Sub-period reconstruction | Explained Variance (R2adj) | Reduction of Error (RE) | Standard Error of the Estimate | PRESS |
| 1 (1922-2006) | 0.47 | 1.550 | 0.439 | |
| 2 (1922-1963) | 0.25 | 0.53 | 1.462 | 0.189 |
| 3 (1964-2005) | 0.56 | 0.29 | 1.640 | 0.511 |
Regional Calibration and Validation
| Sub-period reconstruction | Explained Variance (R2adj) | Reduction of Error (RE) | Standard Error of the Estimate | PRESS |
| 1 (1922-2006) | 0.56 | 1.412 | 0.525 | |
| 2 (1922-1963) | 0.31 | 0.64 | 1.404 | 0.220 |
| 3 (1964-2005) | 0.66 | 0.34 | 1.447 | 0.599 |
(For explanations of these statistics, see this document (PDF), and also the Reconstruction Case Study page.)
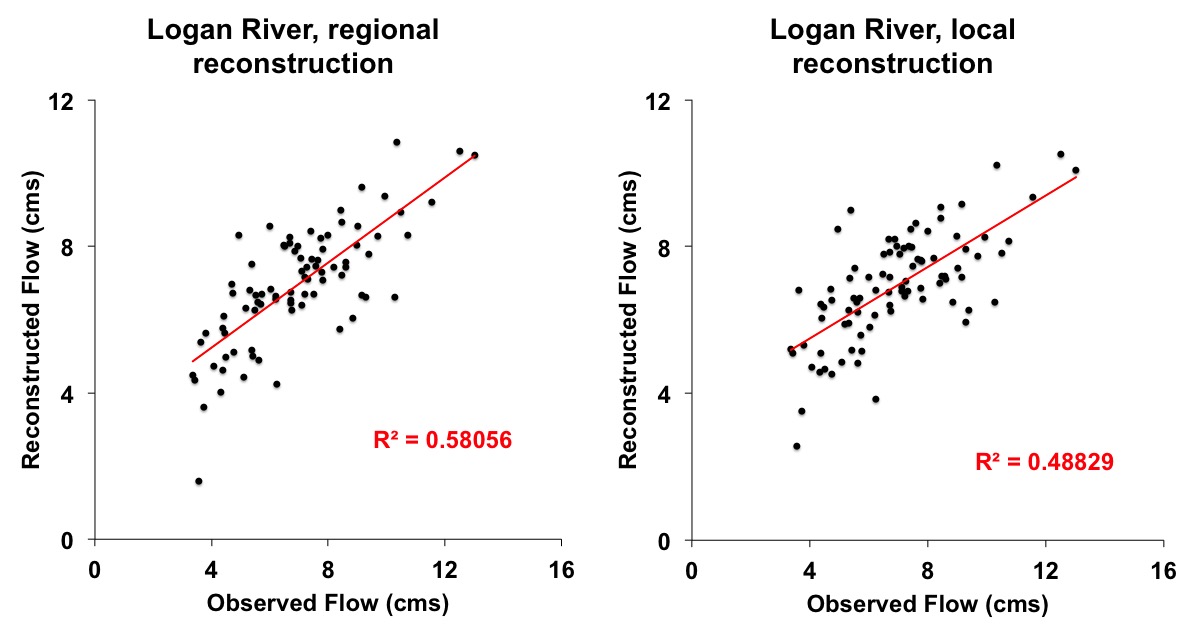
Figure 1. Scatterplots of observed and reconstructed Logan River annual flow, regional 1922-2005 and local 1922-2010.
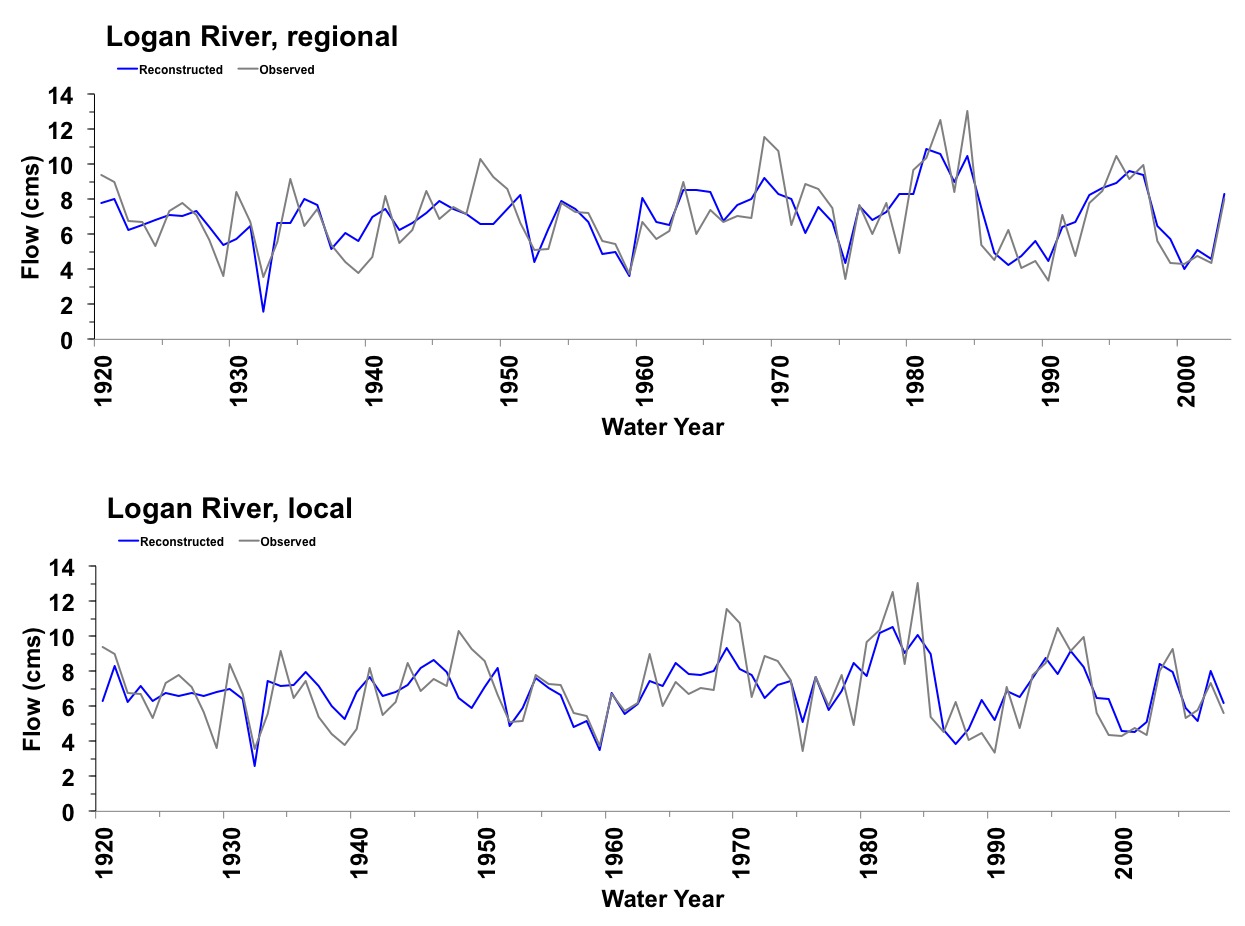
Figure 2. Observed (grey) and reconstructed (blue) annual Logan River annual flow, regional 1922-2005 and local 1922-2010.
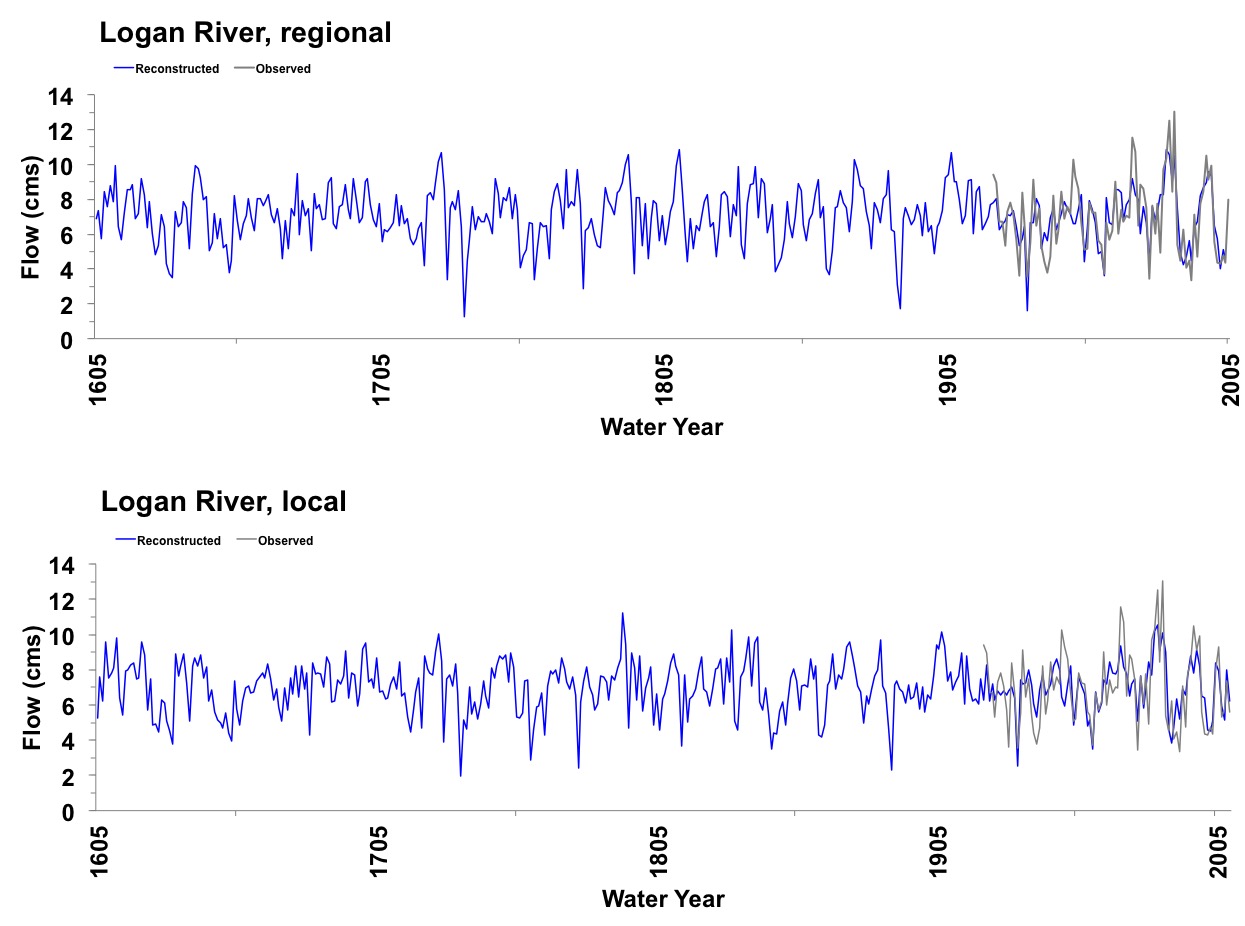
Figure 3. Reconstructed annual flow for the Logan River (1605-2006; 1605-2010) is shown in blue. Observed flow is shown in gray.
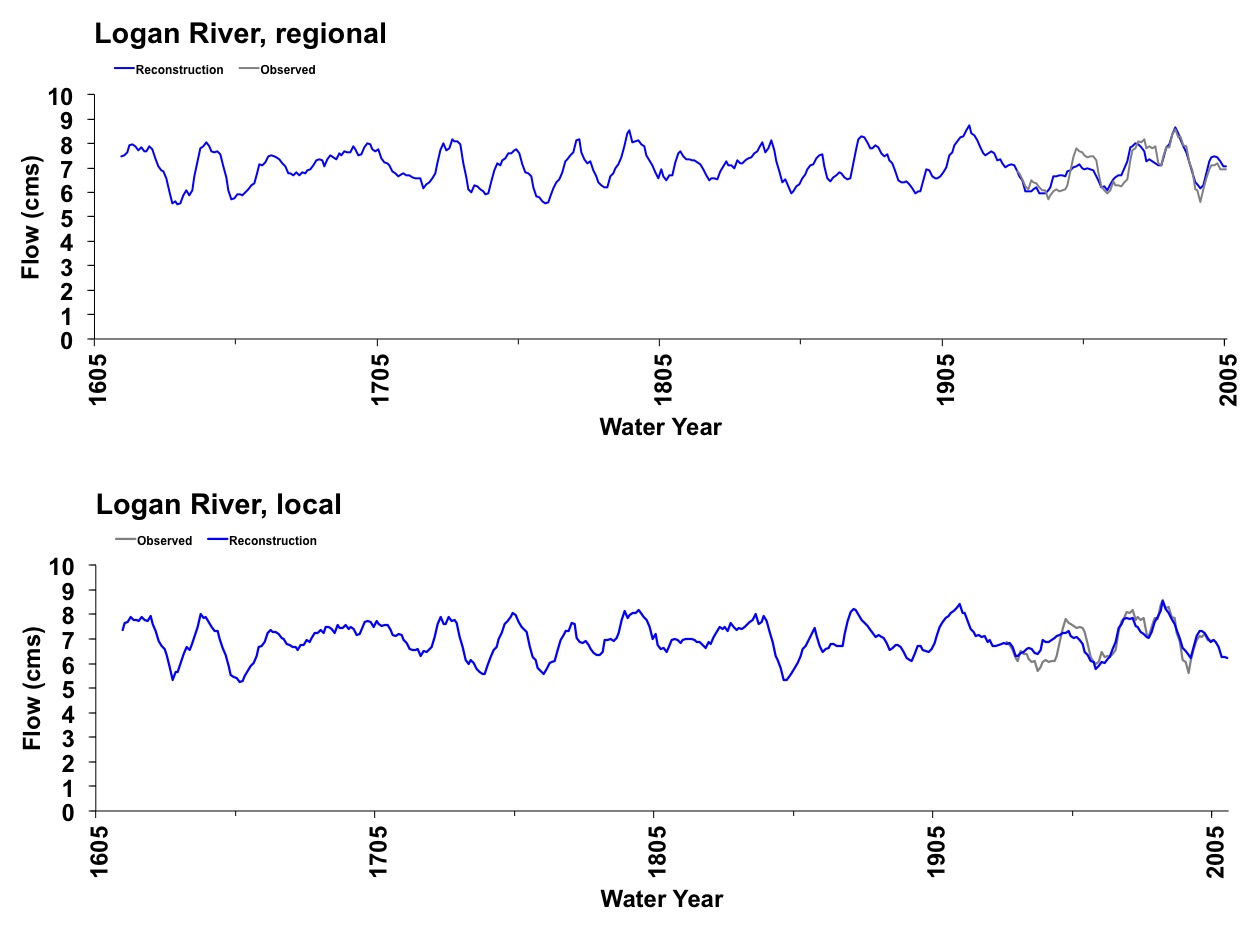
Figure 4. The 10-year running mean (plotted on final year) of reconstructed Logan River flow, regional 1605-2006 and local 1605-2010. Reconstructed values are shown in blue and observed values are shown in gray.

