
Weber River
The Weber River Basin, located in northern Utah, is one of the most important water supplies in the Wasatch Front, which includes municipalities of Salt Lake City and Provo. Used primarily for irrigation of crops, over the past decades, the water supply is increasingly being used to meet municipal and industrial needs. The long-term hydroclimatology of northern Utah is marked by considerable uncertainty; hence, our reconstruction provides water managers with a more complete record of water resource variability for assessment of the risk of droughts and floods for one of the largest and most rapidly growing population centers in the Intermountain West.
References:
Matthew F. Bekker, R. Justin DeRose, Brendan M. Buckley, Roger K. Kjelgren, and Nathan S. Gill. 2014. A 576-Year Weber River Streamflow Reconstruction from Tree Rings for Water Resource Risk Assessment in the Wasatch Front, Utah. Journal of the American Water Resources Association 50, 1338-1348. doi: 10.1111/jawr.12191
Methods
The reconstruction is based on pinyon pine and Douglas-fir tree ring chronologies from just east of the crest of the Wasatch Mountains (Tanner Ridge, TNR and Rattlesnake Mountain, RSM) and from the rain shadow of the Wasatch Range and south of the Uinta Mountains (Well's Draw Update, WED and Harmon Canyon, HAR). All collections are now included in the International Tree-Ring Data Bank (UT528, UT530, UT533, UT534). Multiple linear regression was used to model and reconstruct streamflow from the tree-ring series. Principal components analysis was to extract the major modes of variability from the set of chronologies, for the current year and the previous and following years (t-1, t+1), which were used as the regression predictors.
Calibration and Validation
| Calibration Period | Explained Variance (R2adj) | Reduction of Error (RE) | Coefficient of Efficiency (CE) |
| 1 (1905-1954) | 0.49 | 0.58 | 0.55 |
| 2 (1955-2004) | 0.63 | 0.48 | 0.44 |
| 3 (1905-2004) | 0.55 |
(For explanations of these statistics, see this document (PDF), and also the Reconstruction Case Study page.)
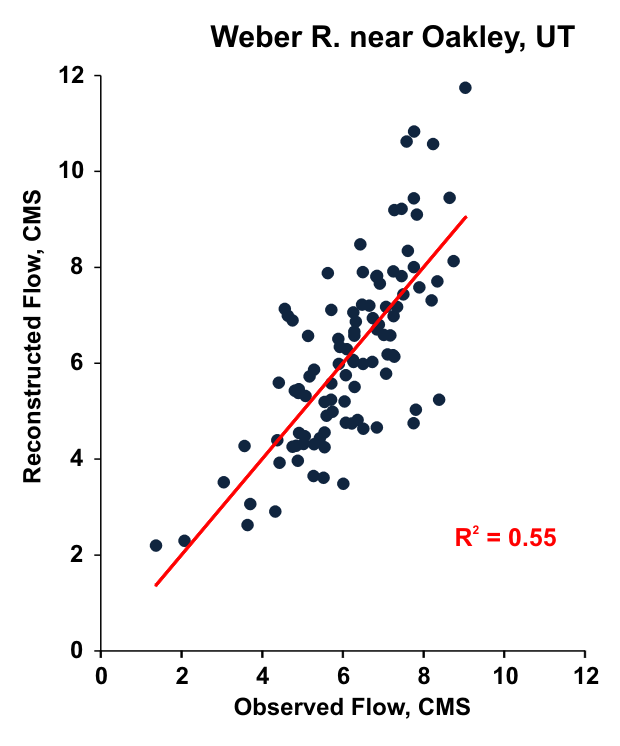
Figure 1. Scatterplot of observed and reconstructed Weber River annual flow, 1905-2004.
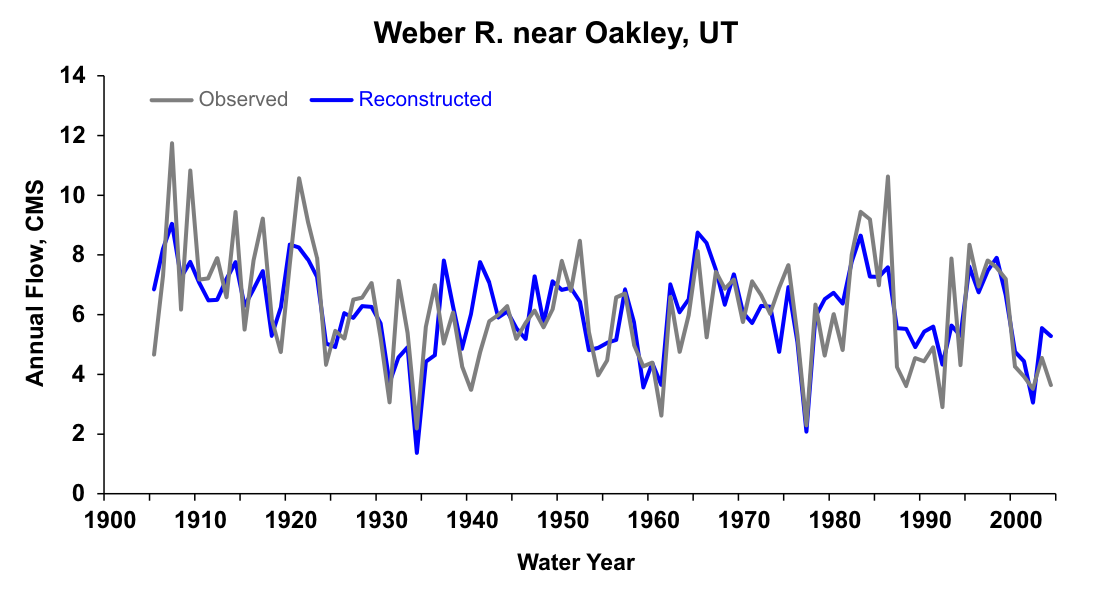
Figure 2. Observed (grey) and reconstructed (blue) annual Weber River annual flow, 1905-2004.
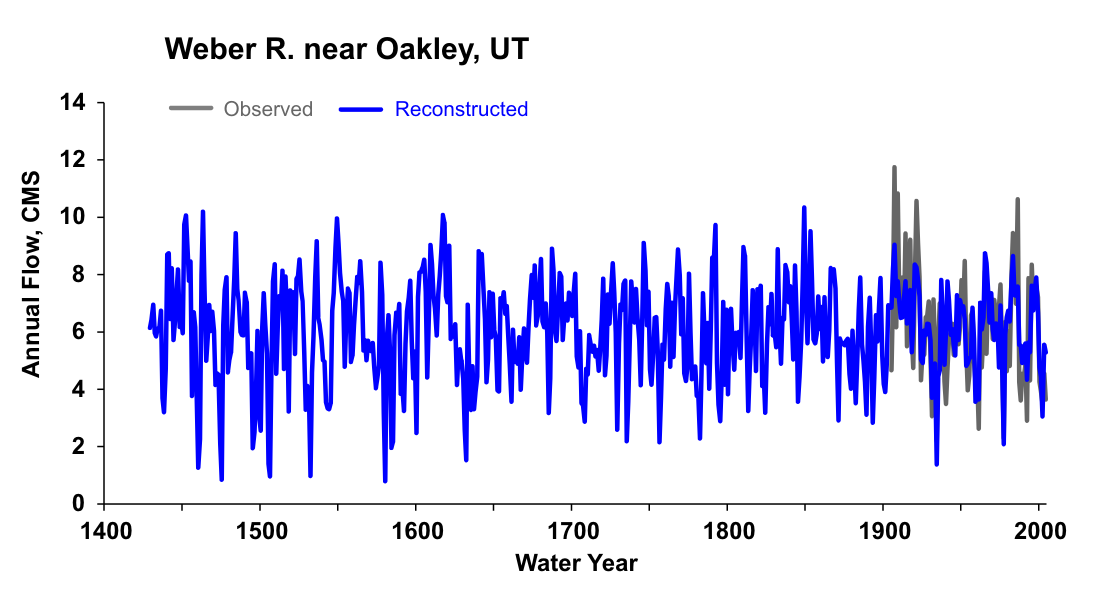
Figure 3. Reconstructed annual flow for the Weber River (1429-2004) is shown in blue. Observed flow is shown in gray.
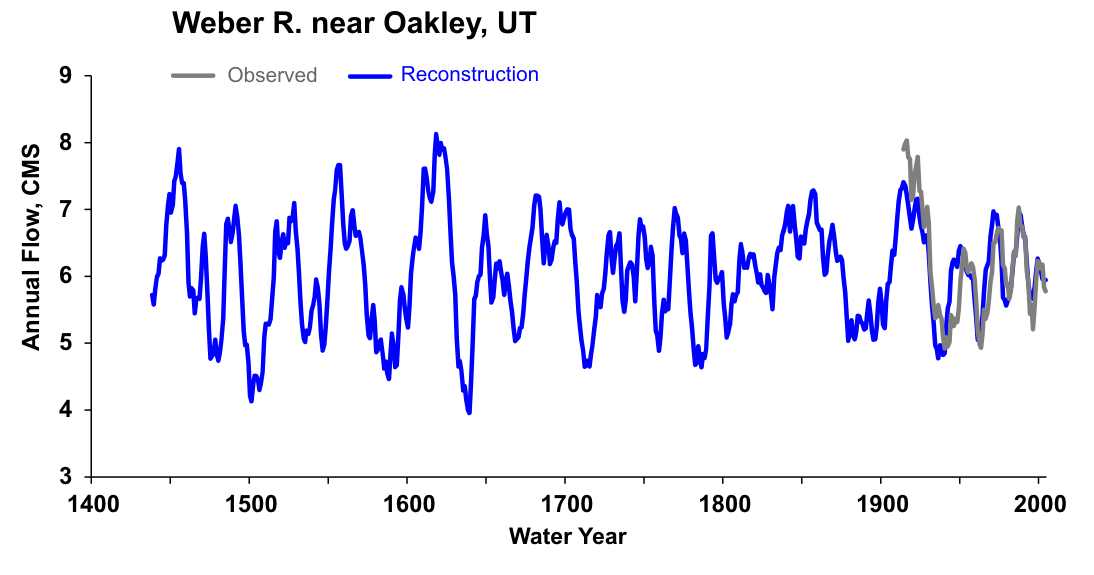
Figure 4. The 10-year running mean (plotted on final year) of reconstructed Weber River flow, 1429-2004. Reconstructed values are shown in blue and observed values are shown in gray.

